presentation graphic
A presentation graphic is a graphic application program that is used in commercial areas. It is used to present extensive columns of figures clearly and concisely. These can be production and sales figures, trend figures and sales, comparative figures and costs.
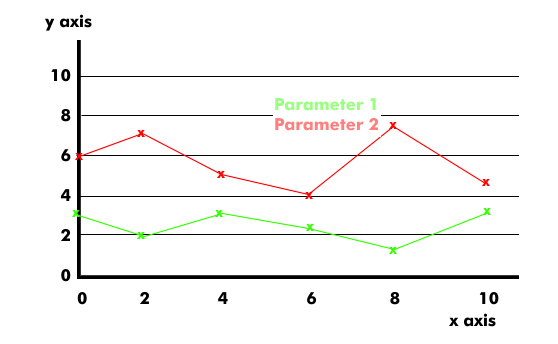
The presentation graphic knows several different representation forms: Line charts, area charts, bar charts and histograms, as well as pie charts in various forms, including two-dimensional and 3D graphics. They also exist in animated form, in which certain lines or areas change color or brightness. Corresponding presentation graphics generate a higher level of attention during presentations.
Presentation graphics are created by corresponding programs directly from rows of numbers and tables. Printouts on paper or transparencies or the presentation with displays or projectors form an important basis for presentations, talks, fairs, meetings and conferences.