pie chart
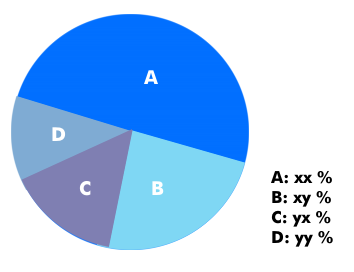
A pie chart is a presentation graphic. Others are the bar chart, the line chart and the area chart. Pie charts represent ratios in a circular form. Such a diagram provides a quick overview and is particularly suitable for comparing a few partial values in relation to a whole.
For example, a pie chart can be used to quickly and clearly show the distribution of parties in a country. The partial values, in the example the voters per party, are indicated in the form of colored circle sectors. The entire circle forms the sum of all voters. Another example would be the religious classification of a population.
The circle sectors of a pie chart are determined by the angle of the circle sector. This is calculated from circle angle of 360 degrees and the total sum (population) in relation to the percentage of a voter group. The angle of the circle vector is: 360 degrees x partial value in relation to the total sum.