collaboration diagram
A collaboration diagram is a functional diagram that shows the interrelationships, functionalities, behaviors, and relationships of the various participants. It has similarities to a flowchart.
A collaboration involves actors and objects that exchange messages and communicate with each other through different communication services. A collaboration involves employees, customers, partners, enterprise suppliers, as well as stationary computers and mobile devices. One group is that of actors, the other is that of objects. Actors are identified in the collaboration diagram by their name and role. They are the instances that invoke interaction in the diagram.
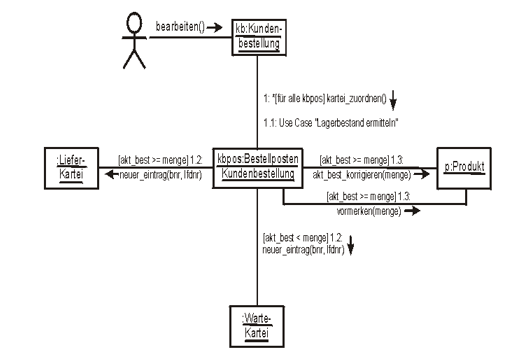
It is different with the objects, which are represented in the collaboration diagram as rectangles with names and properties. There are relationships between the actors and the objects via links, which are also used to exchange messages. In the diagram, the links are represented by a solid line. The messages themselves are used for communication between the objects and are indicated by an arrow located near the corresponding link.
Collaboration diagrams are used to represent crucial relationships between objects. For example, corresponding diagrams give a good overview of collaborating objects in an object-oriented system, or they can be used to model collaborations and interactions.