area chart
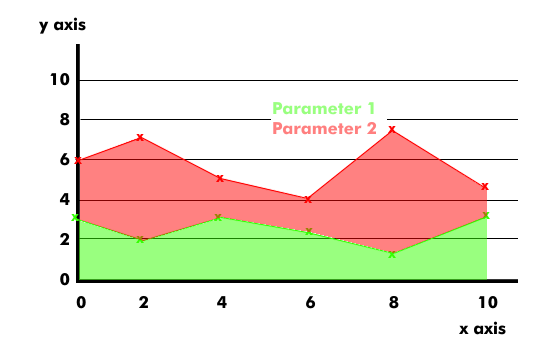
The area chart is derived from the line chart. It is the area that forms under a line chart. This representation is particularly suitable for the comparison of series of measured values.
The area between the X-axis and the line of the line chart are displayed in different colors and hatchings. Overlapping areas can be displayed transparently, which makes the development of several area diagrams clearer.
Area diagrams are used to illustrate developments over a time axis. In these diagrams, the points of the line diagram are often determined by cumulating the values. In addition to the pie chart, the bar chart, the line chart and the pie chart are used in presentation graphics.