Smith chart
The Smith chart is a graphical representation that replaces relatively complicated mathematical relationships with a geometric construct. In this representation, complex numbers are clearly displayed, allowing one to visualize impedance changes on high frequency cables or other RF components. It shows the user how the impedance or admittance behaves at different frequencies due to the reflection coefficient or standing wave ratio( VSWR).
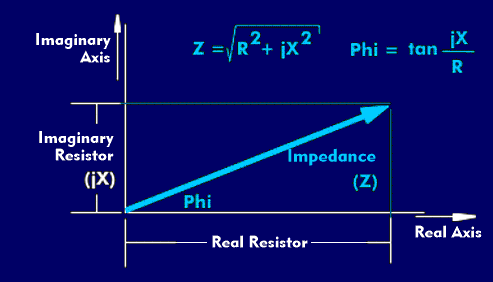
The classical representation of impedances is in the Cartesian coordinate system, where the real and imaginary parts are represented in both axes of the coordinate system. Their proportions are determined by the magnitude (Z) and the angle (Phi). If the real and the imaginary resistance change, then the two quantities "Z" and Phi change. Another form of representation is the polar one, which is used in the Smith chart, but as a normalized, dimensionless impedance.
Structure of the Smith chart
The Smith chart is a circular coordinate system for plotting complex impedances of frequency-dependent two-pole, four-pole or RF circuits. Scattering parameters, standing wave ratios, and reflection coefficients are plotted on a circular coordinate system representing impedance or admittance values. Real values are plotted on the horizontal of the Smith chart.
When plotted using the standing wave ratio, these values can range from "0" to infinity. In the vertical axis, the imaginary values +jx and -jx, also lie between "0" and infinity. The horizontal axis is logarithmically divided, each value between "0" and infinity is represented by a circle. The outermost circle corresponds to the value "0", the following circles have diameters corresponding to the reciprocal logarithm. The circle that passes through the center of the 0-circle corresponds to the value "1". The vertical circles for the imaginary values intersect the circles for the real values at an angle of 90°.
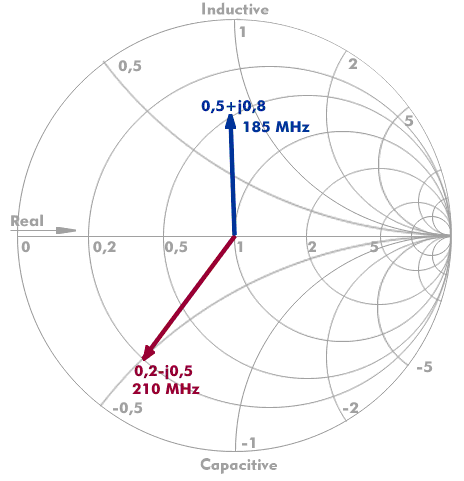
The upper half of the Smith chart represents the inductive reactance, the lower half represents the capacitive reactance. In these circle diagrams, the normalized impedance is represented as a complex dimensionless number. If there is no reactance and the real impedance changes with frequency, then there is a vector on the horizontal.
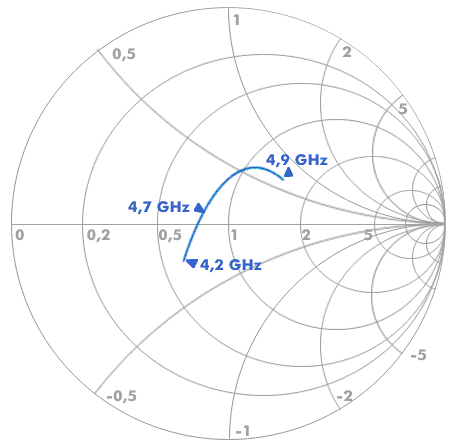
A different frequency results in a different impedance and thus another vector, which may also have an imaginary component. The size of the vectors is a measure of the standing wave ratio. The endpoints of the vectors are connected together to produce a waveform representing the vector endpoints at each frequency. Since there is no frequency reference in the Smith chart, the individual frequencies must be marked on the chart.
Representation with the Smith chart
The Smith chart is used to represent the standing wave behavior of quadrupoles. These can be RF connectors, RFcables or antennas.
The name of the Smith chart is due to its developer Philip Smith of Bell Labs, who developed the Smith chart in the 1930s.